YouTube交易学习· 13:36
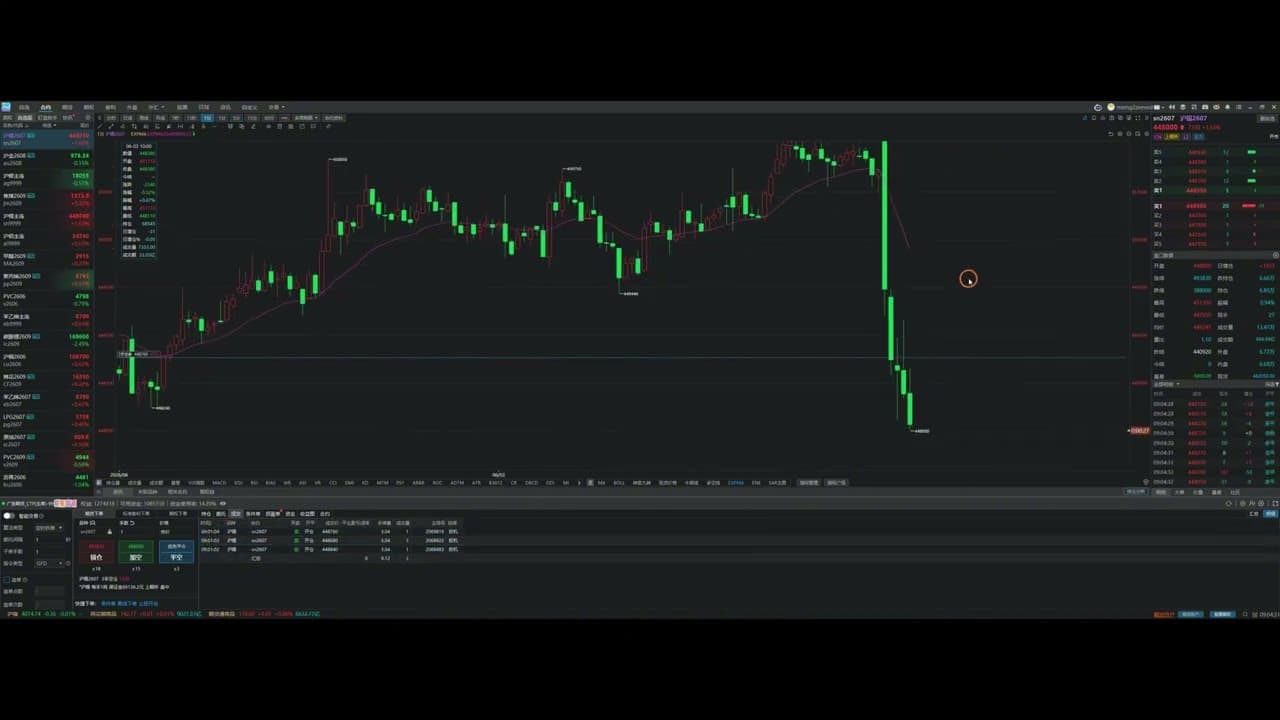
【价格行为学】实盘边做边讲:沪锡期货剥头皮离场,两倍盈亏比+10400
本期实盘边做边讲聚焦沪锡期货,市场缺乏明显的波段趋势行情,只能以剥头皮方式离场。视频详细展示了在窄幅震荡市中如何识别交易机会、管理风险,并最终实现两倍实际盈亏比、盈利+10400的完整交易过程。
#价格行为#沪锡期货#剥头皮#实盘交易#Al Brooks#盈亏比#方方土
2026-06-0900
阅读笔记 →当前内容库
2
笔记
2
分类
8
标签
Latest notes
本期实盘边做边讲聚焦沪锡期货,市场缺乏明显的波段趋势行情,只能以剥头皮方式离场。视频详细展示了在窄幅震荡市中如何识别交易机会、管理风险,并最终实现两倍实际盈亏比、盈利+10400的完整交易过程。
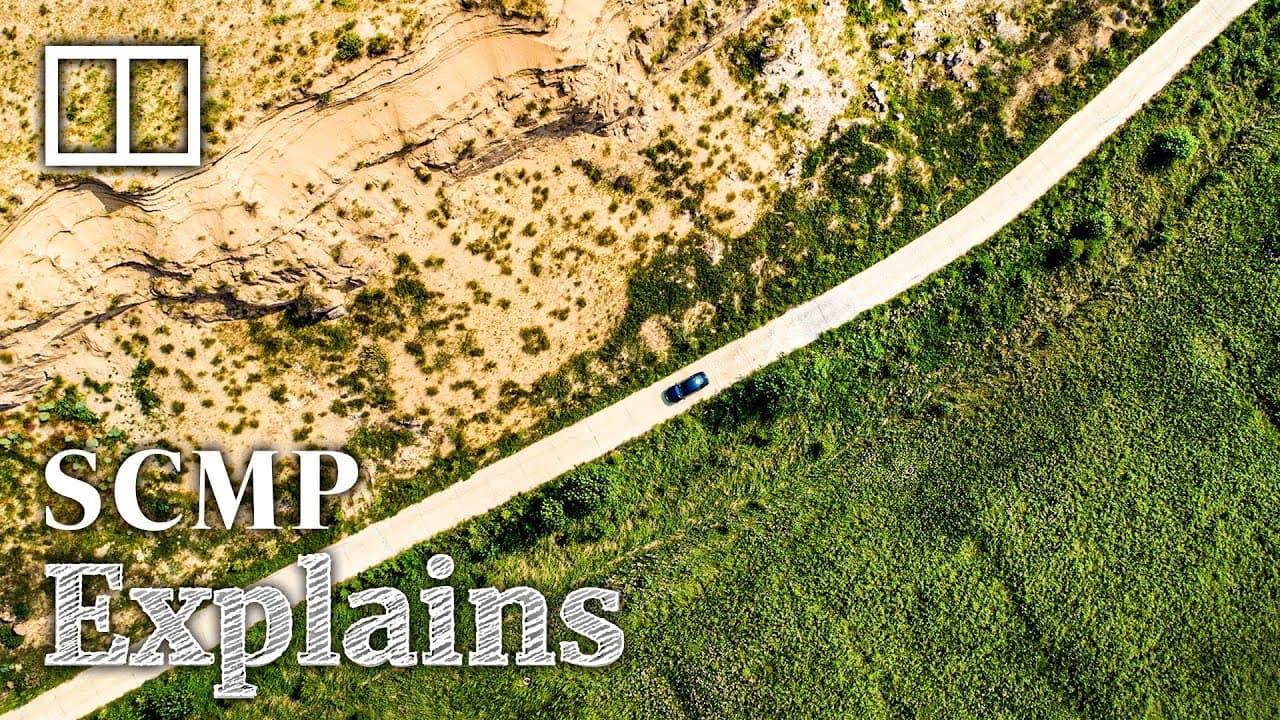
南华早报深入报道中国为遏制沙漠化而实施的「绿色长城」三北防护林工程——从1978年至今已种植近3000万公顷植被,但仅十分之一在沙地中存活。本文梳理了该计划的成败得失与未来方向。
Popular